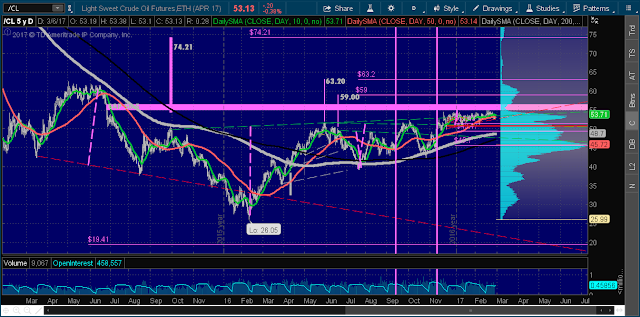
Stock indexes have hit, or are near hitting, inverted head and shoulders target prices for long, intermediate, and shorter term time frames. Some of them do have large time frame double bottoms working too, however that pattern isn't as reliable as head inverted head and shoulders patterns. Oil has been bouncing between $51 and $55.
The S&P 500 has hit vW's (inverted head and shoulders) to 2377.75 and went as high as 2401.
S&P 500 Weekly chart shows double bottom toward 2478.75
The Russell has hit vW target of 1404.6
It does have a vW about 13% higher towards 1599, but will need other indexes support getting there.
The Dow has hit its long term time frame vW to 20296. Still has a shorter term time frame vW to 21255 working. It also has a long term double bottom to 21560 to 21952, depending on whether you calculate the target price with the Weekly chart or a daily chart.
The XLF has hit shorter term target prices. It does have vW patterns higher that formed during the 2008-2009 crash, but they are ugly.
Oil has been bouncing between 55 and 51. vW's to 59 and 63.20 are triggered. Has resistance from a gap at 56.5 it needs to get through. Needs to hold above $51, otherwise will likely see further selling to vM 45.70
$
Gold still rallying off the vM 1129.8 target price.
Bond Futures.
IBB


